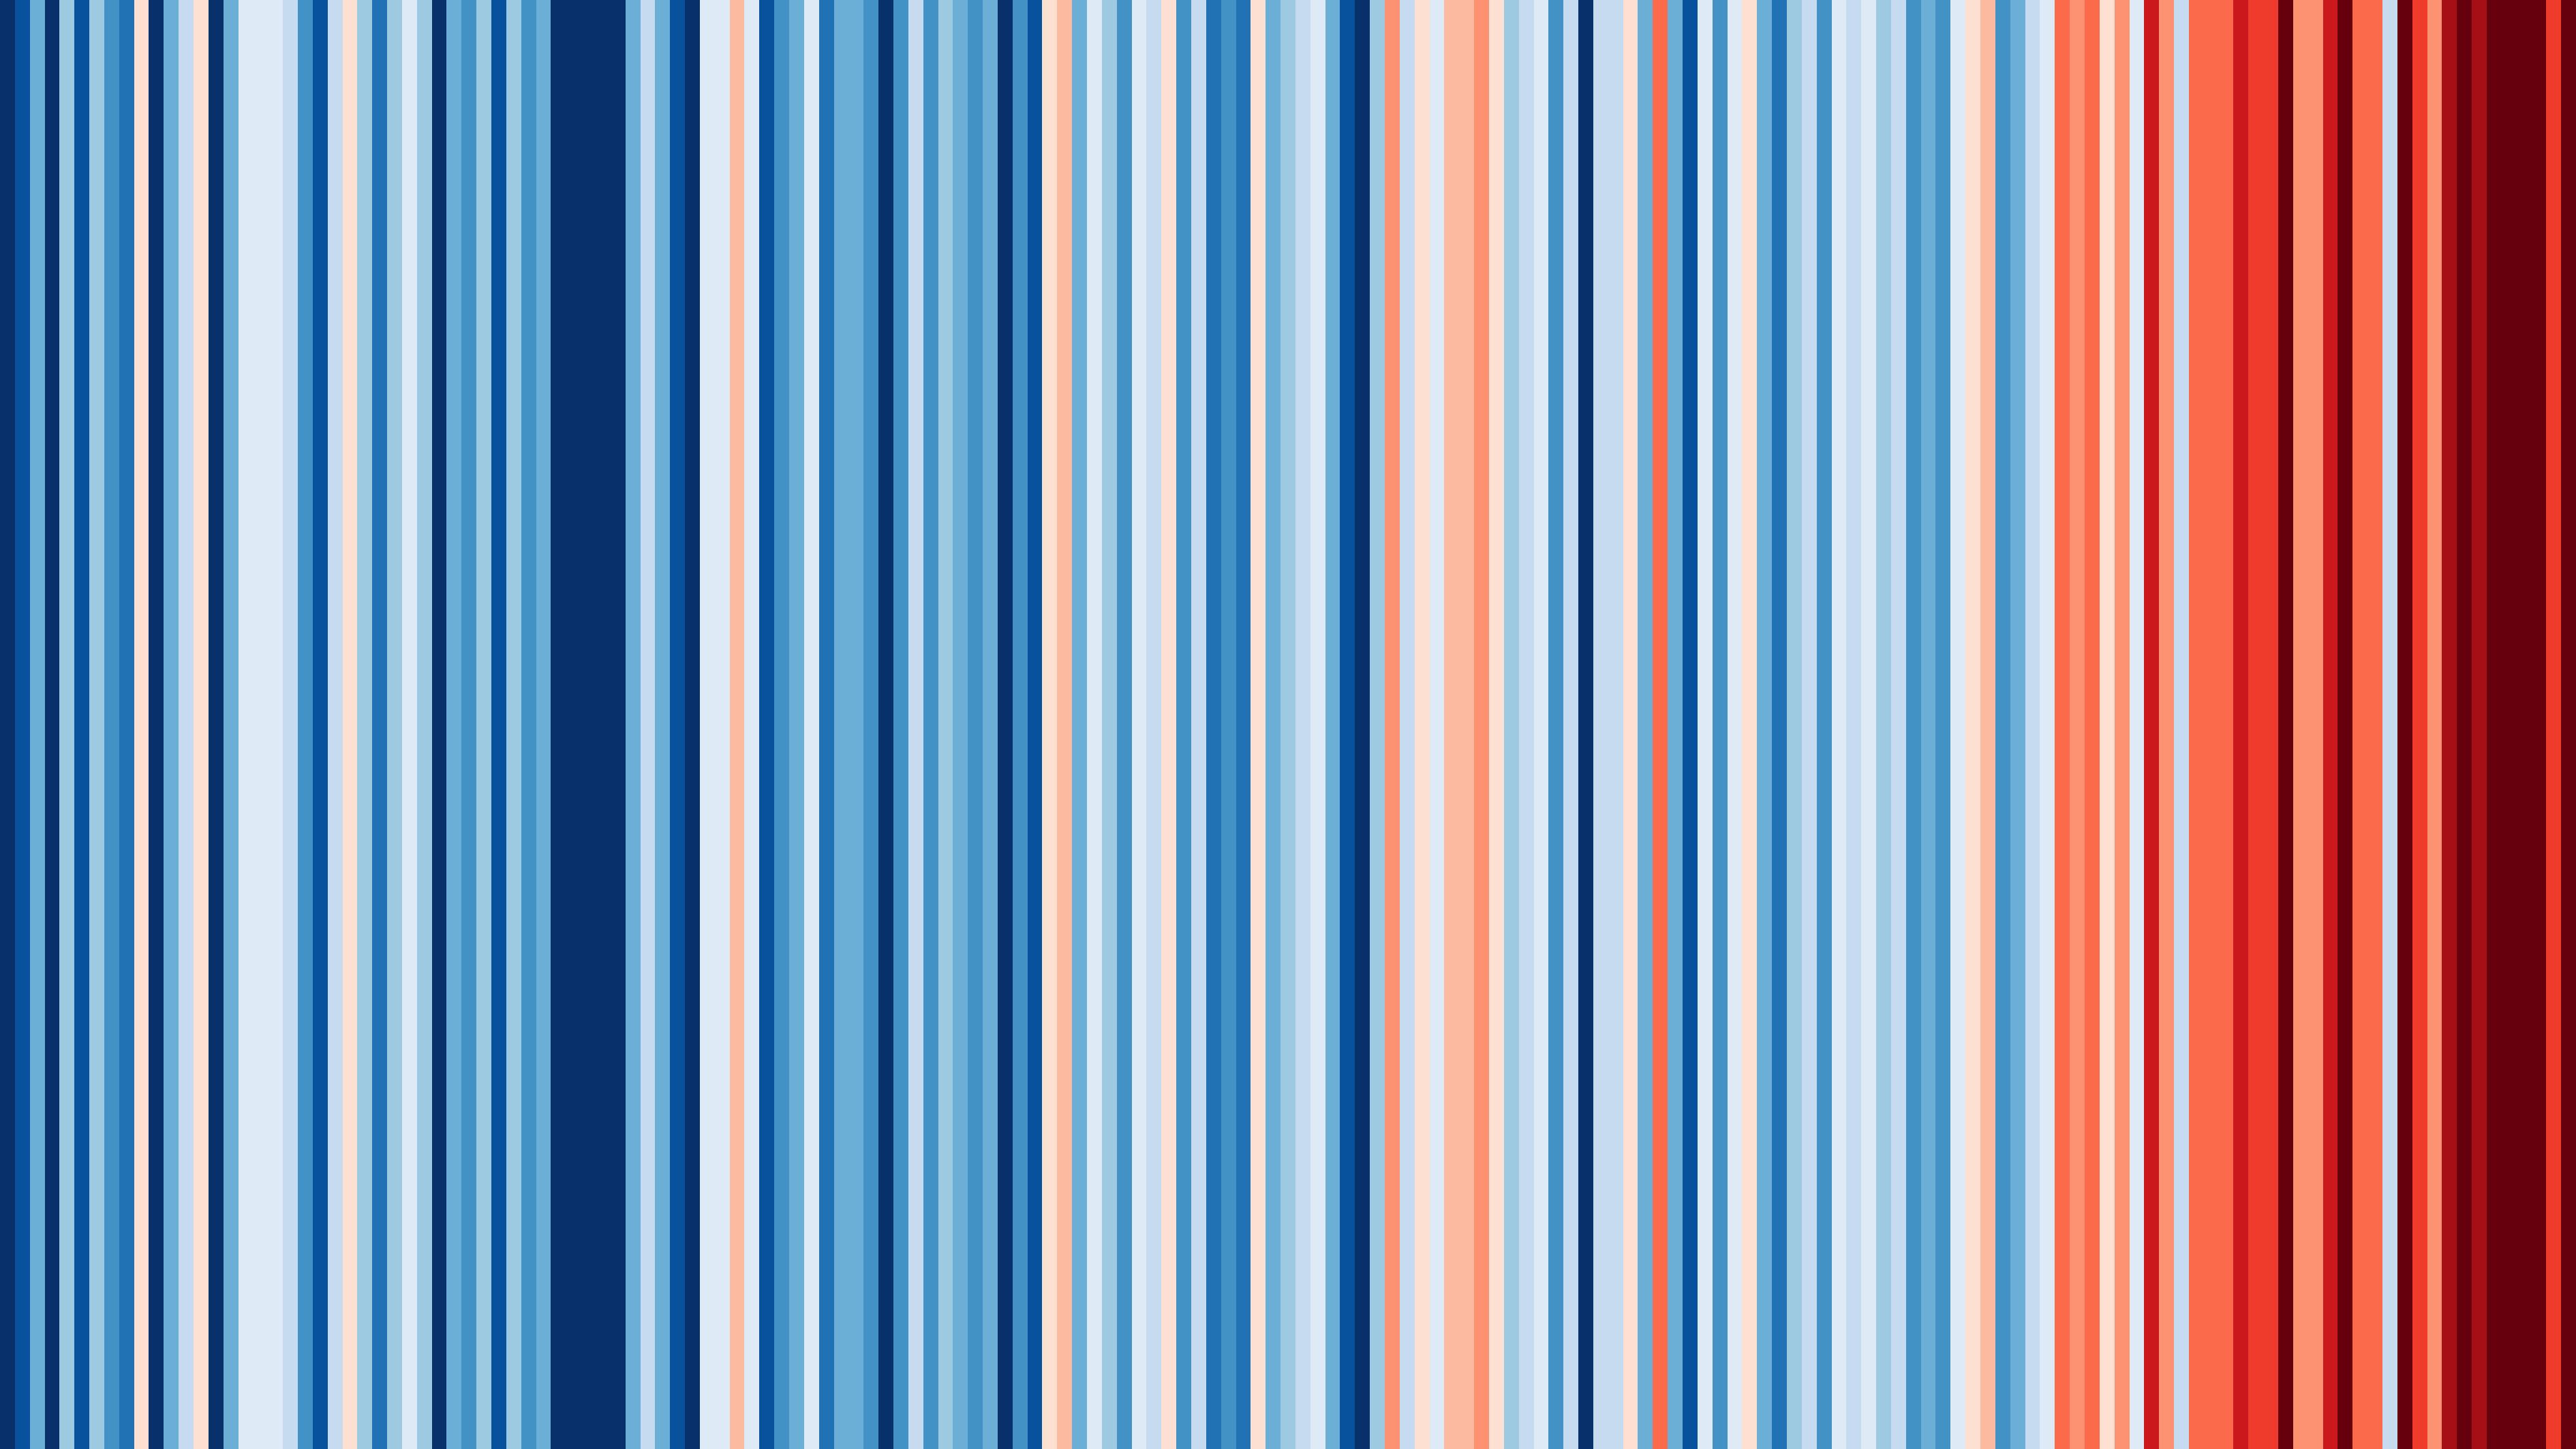
Last week, a stark climate change message was illuminated onto the White Cliffs of Dover (UK). Then, skyscrapers, stadiums and, across the pond, signs in Times Square – vertical blue and red bars were displayed all around the world to highlight the progressive rise of global average temperatures over the past 200 years.
Along with the summer solstice, 21st June was the #ShowYourStripes day, a campaign where meteorologists and climatologists spread awareness throughout the world by sharing this effective illustration of the warming that has taken place since the start of the industrial revolution. The campaign involved the action of people, businesses, and organizations, including museums, schools, and media.
These bars are well-known as the “Climate Stripes”, created in 2018 by Ed Hawkins, scientist and professor at the University of Reading and National Centre for Atmospheric Science. No words and no numbers are indicated in the vertical-coloured bars – yet their striking image has a strong communication potential.
«Displaying the stripes on the White Cliffs of Dover and other landmarks will hopefully lead to more conversations about our warming world and inspire people to work together to tackle climate change» Ed Hawkins
Indeed, the stripes clearly show the rise of temperatures – they turn from mainly blue (low) to mainly red (high) in more recent years. It is a powerful tool because its visual message can be grasped at the first glance (no translation needed!).
“Climate Stripes” can be downloaded by anyone, thanks to an open-source platform, called Show Your Stripes. For virtually every country, region or city, the user can generate the bars, illustrating the rise in average temperatures in the given location. These graphics are designed to be as simple as possible – a starting point to enable communication with minimal scientific knowledge to understand their meaning.
The platform also presents a spin-off initiative, that is the “Biodiversity Stripes”. Same tenet, the bars provide a visual representation of the change in flora and fauna over time: the highest level of biodiversity is coloured bright green, whereas lower levels move through yellow to grey – darker greys appear with greater declines.
For sure, this communication strategy is a different way of showing the change. It is simple and capture attention, making the problem visible. The bars are a minimal way to display a complex scientific work of research and datasets analysis. Transparency and clarity are being acknowledged all around the world, and 2023 #ShowYourStripes day proved it right!
Cover image: climate stripes in Europe, Italy, Turin.

